It may happen to individuals, and is also prevalent with companies. With individuals it is a case where a schemer lures investors with high returns, and with the proceeds pays off previous investors. The scheme requires an ever increasing cash inflows to pay off a growing set of existing investors. Ultimately the amount of new cash inflows is insufficient to cover the outflows, and the house of cards falls apart.
This scheme was perfected by Charles Ponzi back in 1920s and has been used countless times since, more recently Bernard Madoff. Is this practiced with companies and what is the credit risk implications?
How it happens with Companies A similar scheme is practiced with companies, the most obvious being the Solo case in the UAE. Only this time it is more elaborate, and in most cases it is not even recognized as an organized scheme by the company, its shareholders nor its bankers. Companies that have a weak Engine continue to expand, therefore place a strain on their cash flows, in return keep borrowing more from an eager and unaware set of bankers, and ultimately the amount borrowed cannot be repaid from existing cash flow generation. We do not call this the Ponzi scheme as that has a connotation of a well thought out and deliberate criminal act of deception. However it works in exactly the same way, with neither the company nor the bank being aware of getting sucked into a cash flow black hole. Why? Because the company’s focus is on enlarging the income statement with limited finesse in cash flow management; and the bankers keep looking at the wrong indicators for signs of trouble (see all our countless previous articles on this topic).
The only place you can see this happen is in the cash flow, and proper financial analysis.
It gets worse Some companies keep asking their shareholders to increase capital, and in return they pay a certain percentage in dividends. Without the increase in capital, payment of dividends becomes an issue, the share price of the company declines, and that’s not good for existing shareholders. Some companies elect to switch to bank finance to pay dividends, but this can be detected quickly through their DSCRs; whereas the capital increase is a limited more intricate to fathom.
Example Let us take a company that produces something, anything. Its Engine is weak, and is covered by bank debt; and therefore is insufficient to cover dividend payments (being generous here). So the shareholders go out every year and seek increases in capital from new investors with a promise of a 10% payout. The picture in the Equity account looks something like this:
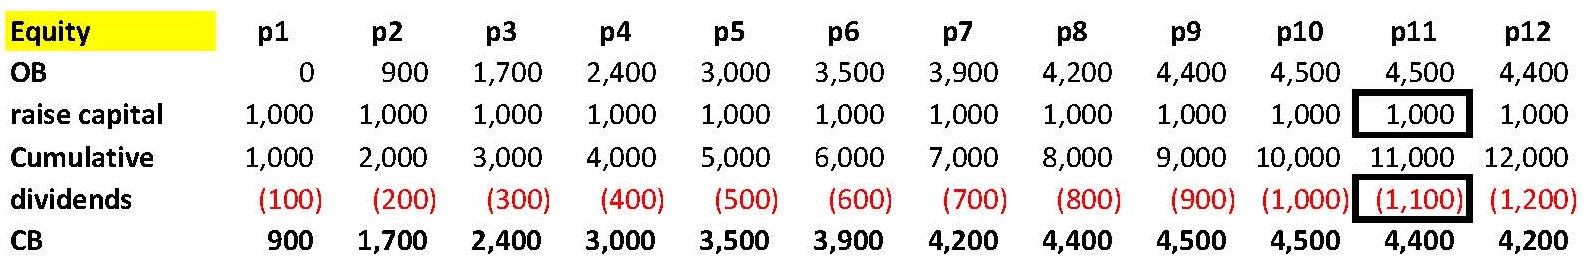
The above table is an example of movements in the Equity section of a balance sheet across several periods (p1-p12), with OB standing for Opening Balance (zero in the beginning), Raise Capital being the added Capital that is raised in each period, Cumulative is the accumulation of capital at any one period (an increase of 1,000 each period), Dividends being those paid (set at 10% of Cumulative Capital), and CB being the Closing Balance at the end of each period.
As you can see, as new capital is raised, the closing balance of Equity keeps on increasing. However the rate of increase declines with time as dividends grow in line with an increasing cumulative capital base. By the 11th period, the amount paid out in dividends is greater than the amount raised in capital, and the closing balance begins to deteriorate.
The timing of decline will depend on the rate of dividends applied. In the above example, with a 10% dividend rate, and 1,000 units increase in capital in each period, the decline begins in month 11. It is the percentage of dividends to capital that matters, not the amount of capital raised. If a company plays its cards right, and lowers the dividend rate to say 4%, the decline will start in year 24.
This picture can also apply to any other account, such as investments. As long as the rate of return is managed through sustained new investors, then the scheme can continue (in theory) endlessly. In reality though there is a limit to the availability of large new money, and the scheme will crumble at some point in time.
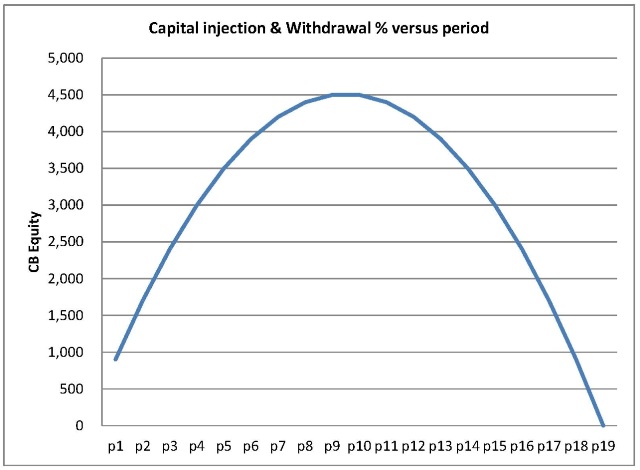
Expressed Graphically Below is a graph that clearly shows these numbers, with the peek hitting around month 10, and thereafter the amount of capital brought in is insufficient to cover ever increasing dividend payments, resulting in a fast declining equity balance.
Expressed Mathematically For those of you who are so inclined, it would be best to express this scheme mathematically. By doing so you are able to see where the closing balance is at any period, and more importantly by using calculus, you are able to know when the peek is reached.
Without going into too much detail, the formula that best describes this scheme is as follows:
Closing Balance = nC(1-x(n+1)/2)
Where n = period; C=capital increase, x=rate of dividends. If the amount of capital or rate of interest vary, then this will be simple functions of changes to C and x respectively.
The derivative of this is: -nCx+C(1-x/2). If C= 1,000 ; x= 10%, for this to be zero, n = 9.5. So the maximum is reached in period 9.5.
How to detect it In our 6 Sigma’s signature credit risk analysis methodology, we have managed to produce a robust way to help the detection of red flags, and particularly those related to obligor behavior. So if you are using our cash flow analysis, look out for weak Engines, Withdrawals and Capital increases. It maybe that the obligor is inadvertently using a Ponzi scheme.
© 2014 6 Sigma Group
While the information contained herein is believed to be accurate, neither 6 Sigma nor any of its affiliates or subsidiaries or its employees makes any representation or warranty, express or implied, as to the accuracy or completeness of the information set out in this document or that it will remain unchanged after the date of issue of this document, and accordingly neither 6 Sigma nor any of their respective affiliates or subsidiaries or employees has any responsibility for such information. This document is not intended by 6 Sigma to provide the sole basis of any credit decision or other evaluation and should not be considered as a recommendation by 6 Sigma that any recipient of this document should purchase an equity stake in, provide credit facilities to, or conduct any business with any company(ies) listed in this document. Each recipient should determine its interest in the information provided herein upon such independent investigations as it deems necessary and appropriate for such purpose without reliance upon 6 Sigma.
WANT TO USE THIS ARTICLE IN YOUR NEWSLETTER OR WEB SITE? You can, as long as you include this complete phrase with it:
“6 Sigma Group teaches bankers around the world how to become better bankers. Get the “5 Mistakes Bankers Do in Credit Analysis” at www.credit-risk-store.com”